About
ImageDataExtractor is an open-source python package for automatically extracting quantitative data from microscopy images.
Check out the documentation to get started, or look below to see how it works.
Image Mining
Figure captions within scientific documents are first mined with ChemDataExtractor using keywords that identify possible microscopy images within them. If the corresponding Figures of the document are of the form of multiple image panels, these panels are then separated into their constituent images.
Figure Scraping
ImageDataExtractor uses ChemDataExtractor to automatically detect relevant images from within Figures of a given HTML or XML document.
Figure Splitting
Multi-panel images are separated using our two-step algorithm, by splitting on whitespace and integer fractions of the image.
Particle Detection
Particle regions are identified and the scalebar's pixel/value ratio extracted.
Scalebar Detection
Scalebar regions are located and the value and unit of the scale read using optical character recognition.
The number of pixels in the scalebar is used to calculate a scale mapping for the image.
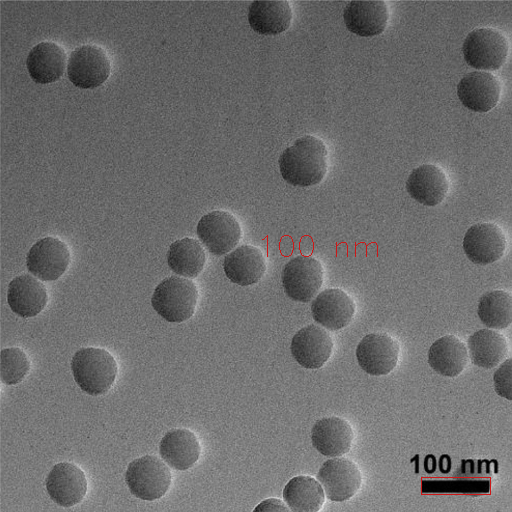
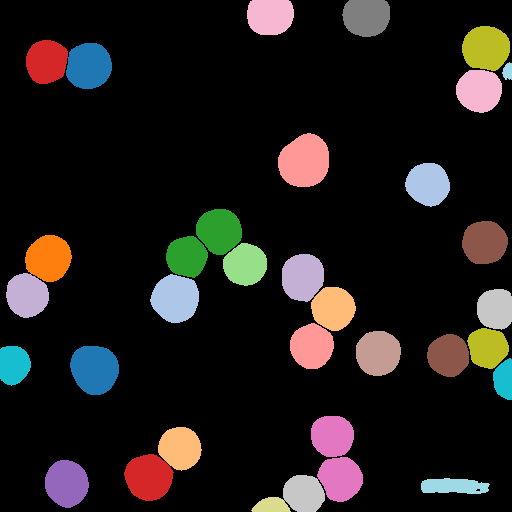
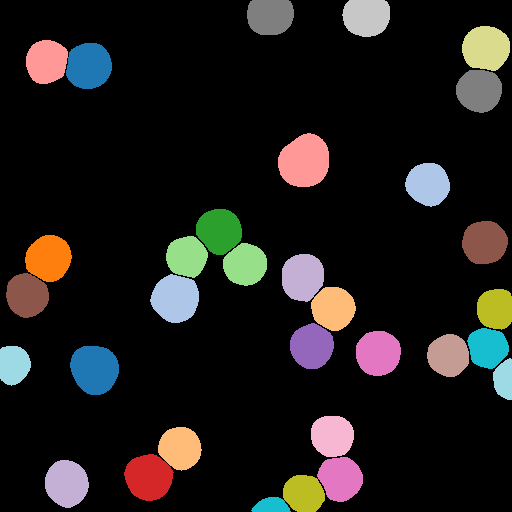
Bayesian Particle Instance Segmentation
Using BPartIS, a state of the art deep learning-based instance segmentation method, particles present in the image are segmented.
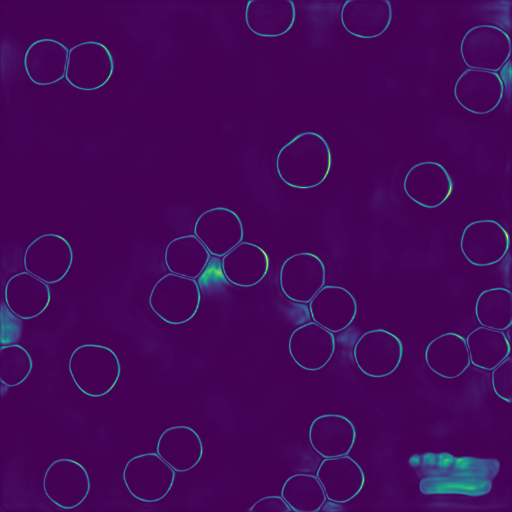
Uncertainty
Performing Bayesian inference with BPartIS affords pixel-wise epistemic uncertainty maps, allowing uncertainties to be assigned to particles.
The scalebar which has been incorrectly segmented has high uncertainty.
Uncertainty-Based False Positive Filtering
False positive segmentations can be filtered based on their uncertainties.
Notice how the incorrect segmentation of the scalebar has been removed, as well as another false positive in the top-right of the image.
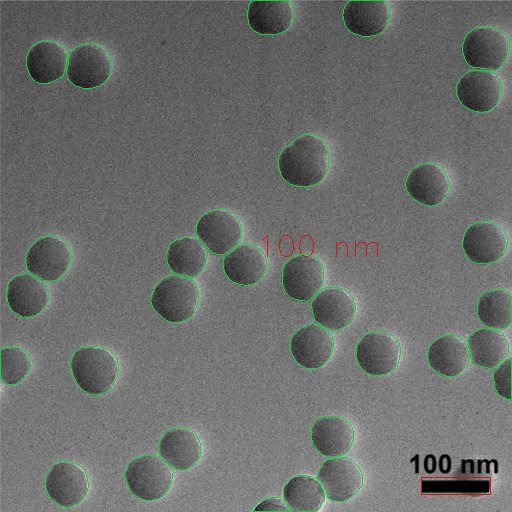
Particle Detection Output
Particle detections can subsequently be used to compute individual/bulk metrics.
Calculate Metrics
Now that the extraction is done, let's look at the results!
ImageDataExtractor automatically generates useful graphics for easy interpretation.
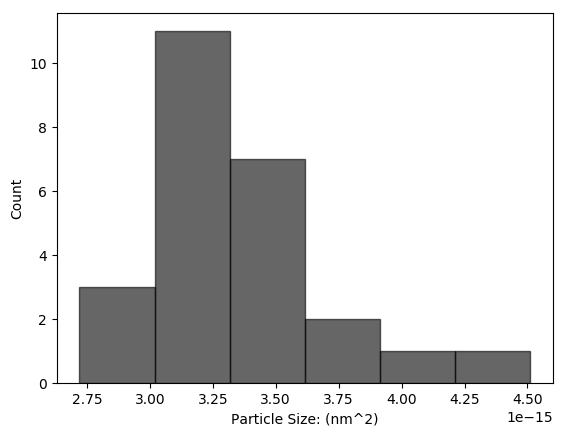
Histogram of Particle Sizes
A histogram of detected particle sizes.
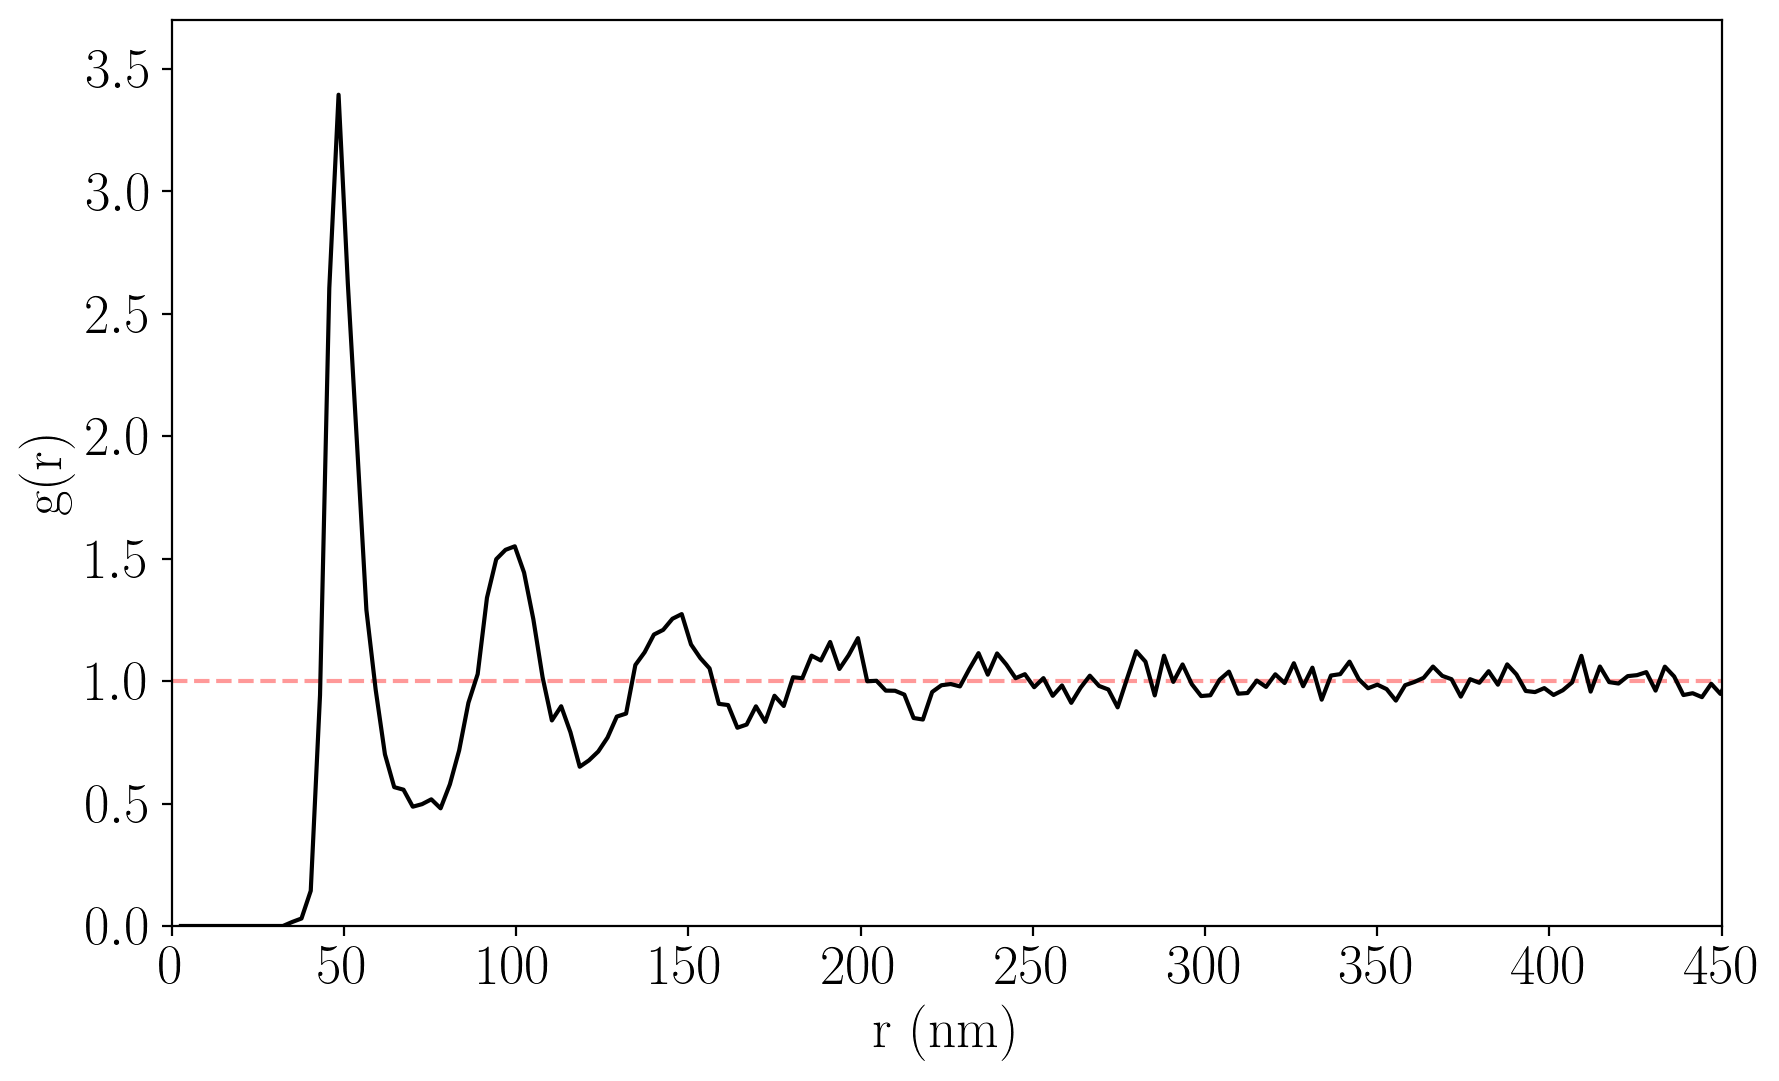
Radial Distribution Function (RDF)
The radial distribution function of detected particles. Particles existing on the edge of the image are filtered prior to computing the RDF.
Note: the RDF shown is computed from a different image to the running example in the Particle Detection section.